Chart
- The chart widget icon is as shown in the figure below.

1. Create a chart widget

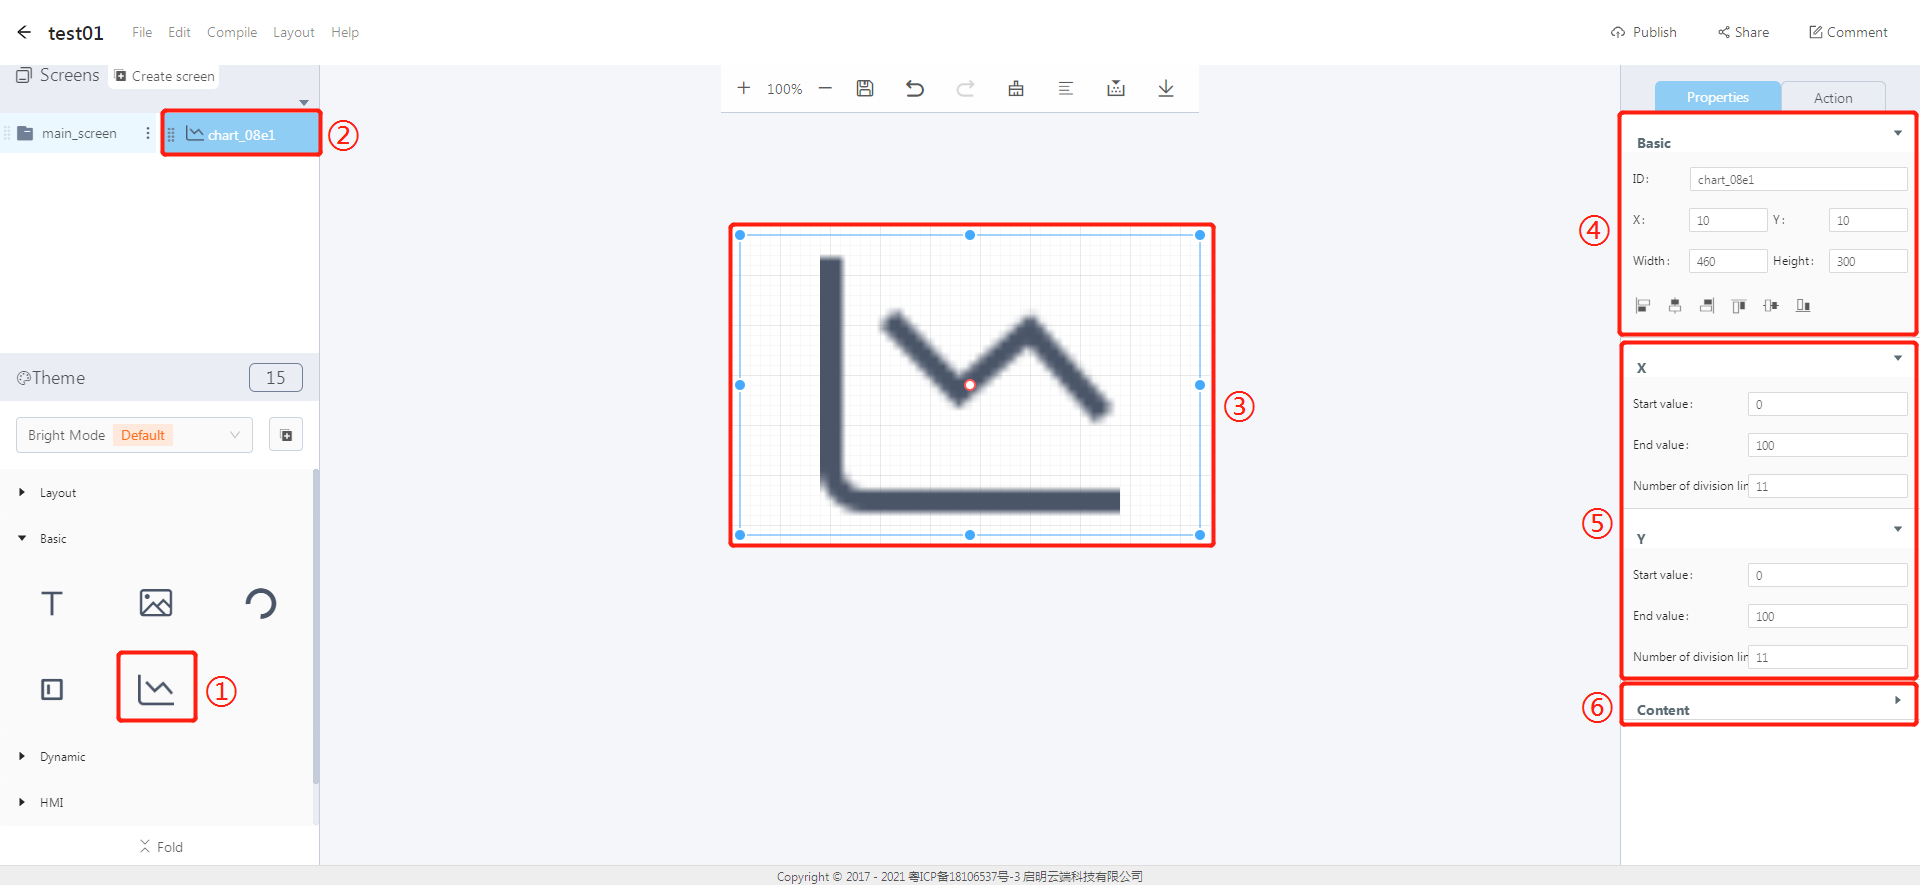
① Click the chart icon to create a chart widget.
② The chart widget ID.
③ Editing area: The position and size of the widget can be modified by dragging and dropping it.
④ Properties-Basic:
- ID: chart_08e1 is the ID number of the chart widget.
- Width, Height: set the size of the chart widget.
- X, Y: its coordinate position in the display area.
- Alignment (in order): left alignment, horizontal center alignment, right alignment, top alignment, vertical center alignment, bottom alignment.
⑤ Properties-X/Y:
- Start value: the start value in X/Y direction.
- End value: the end value in X/Y direction.
- Number of division line: the number of division line in X/Y direction.
⑥ Content:

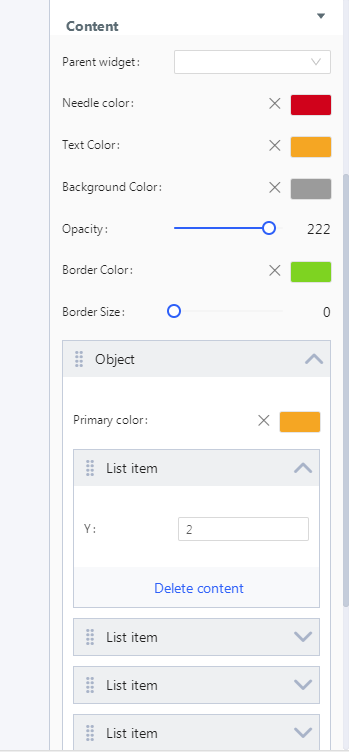
- Parent widget: set the parent object and the chart widget is the child object of the selected ID.
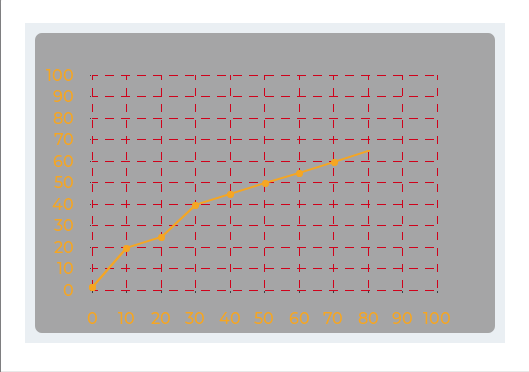
- Needle color: the color of the dotted lines in the X / Y directions of a chart widget.
- Text color: the text color of the labels in a chart.
- Background color: the background color of a chart widget.
- Opacity: the background opacity of a chart widget.
- Border size: the border size of a chart widget.
- Object: It represents a data line in a chart.
- List item: It represents a data point on the corresponding data line.
- Demo:

文档更新时间: 2021-08-06 11:03 作者:plj
